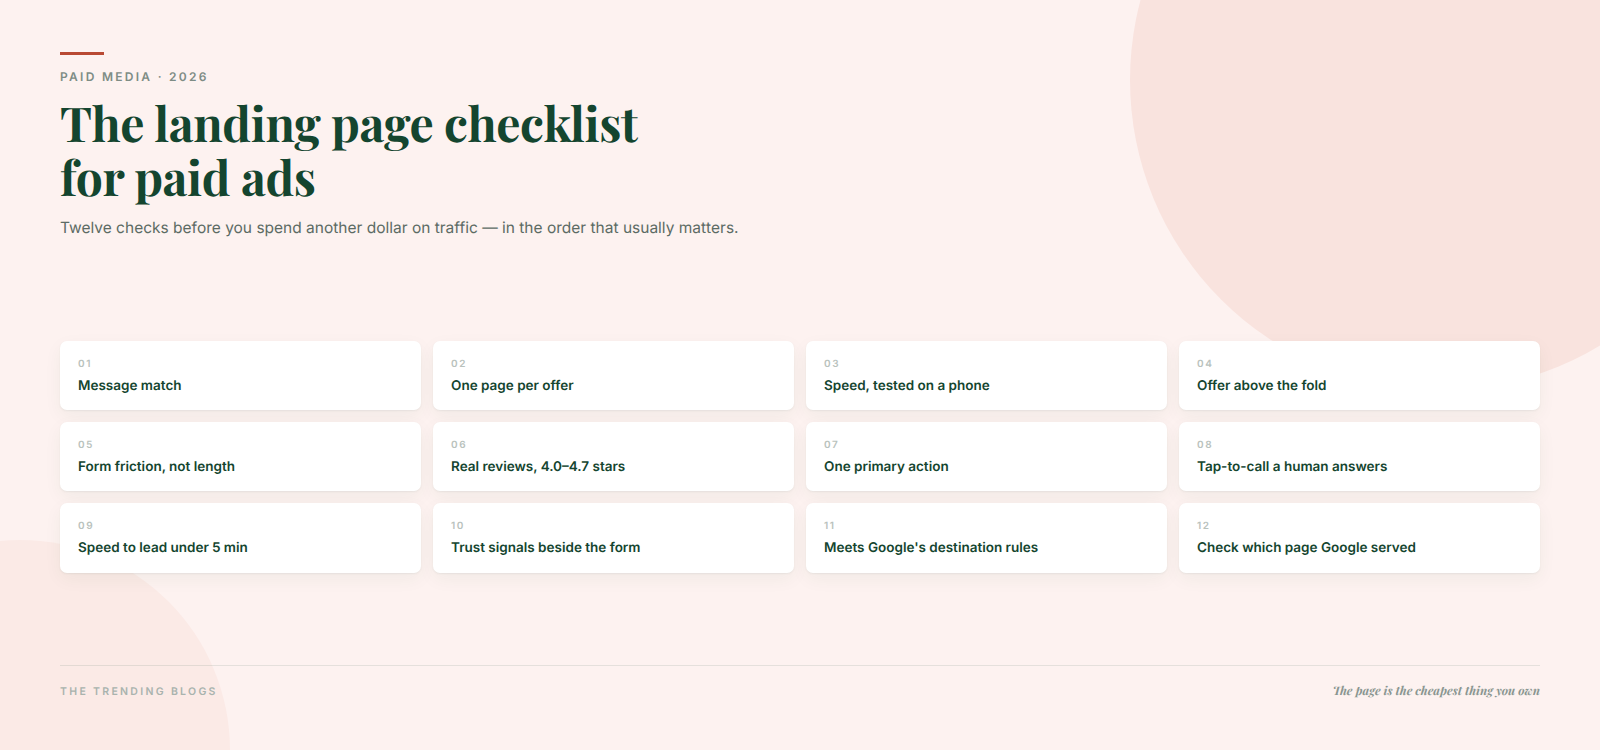
Clicks are getting more expensive and conversion rates on paid social are drifting down. In that environment the landing page is the cheapest thing you can improve, because you already own it. This is the checklist we run before spending another dollar on traffic — twelve checks, in the order that usually matters. Use this landing page checklist for paid ads on Google or Meta before you send more traffic to the page.
First, know what a good conversion rate actually is
Almost every argument about landing pages is really an argument about expectations. Some numbers to anchor on, with their dates, because vintage matters here.
Unbounce’s benchmark study across roughly 41,000 pages — its most recent release, covering 2024 data — put the all-industry median landing page conversion rate at 6.6%, with medians of 4.2% for ecommerce, 6.1% for professional services and 8.3% for financial services. On Google Ads search specifically, WordStream’s 2026 benchmarks across 13,474 US campaigns found an all-industry conversion rate of 8.18% at a $5.42 average CPC and $66.69 cost per lead — and, notably, cost per lead fell for the first time in five years.
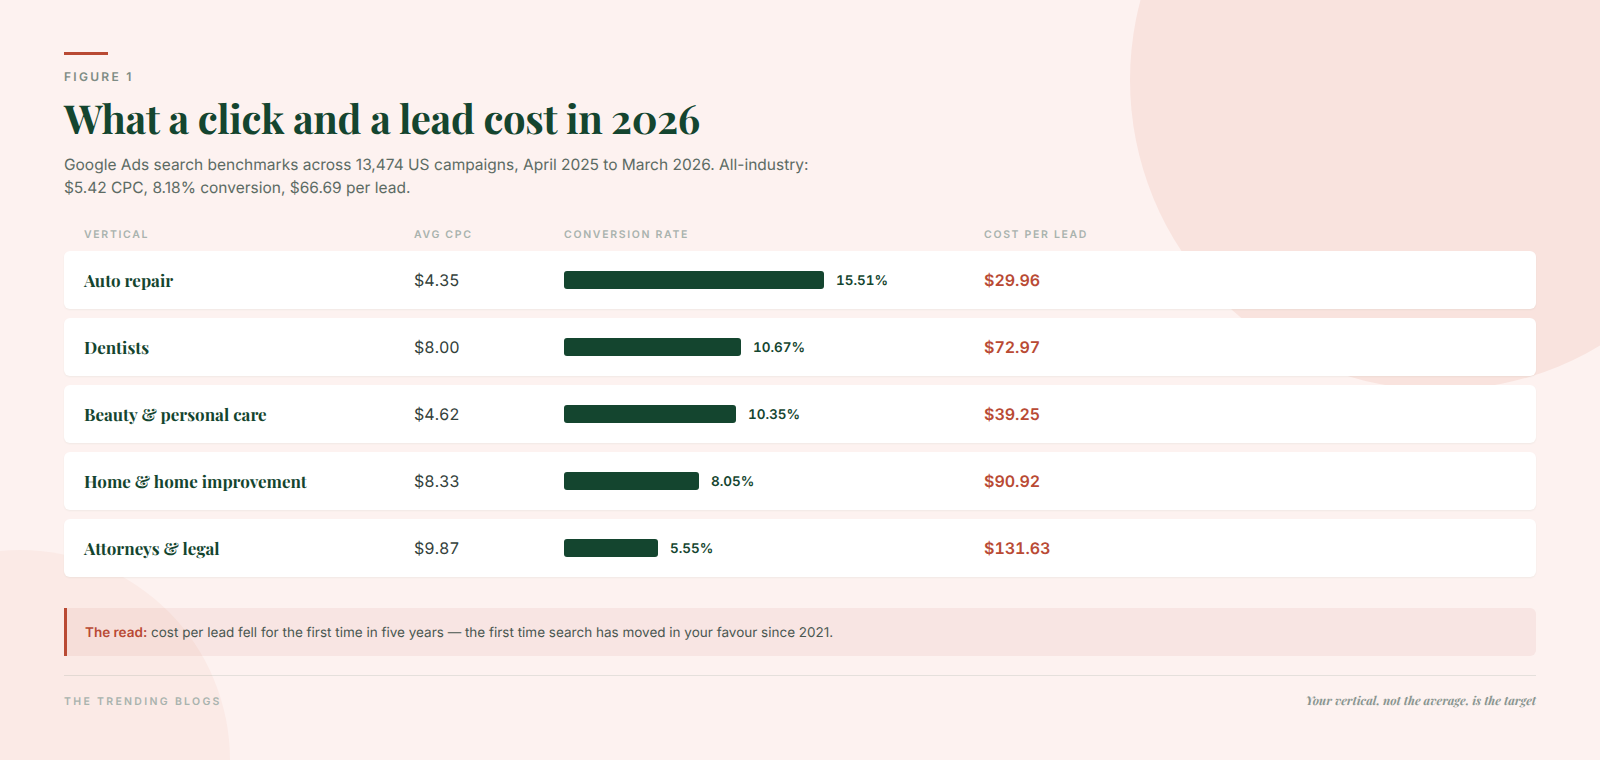
| Vertical (Google Ads search) | Avg CPC | Conv. rate | Cost per lead |
|---|---|---|---|
| Home & home improvement | $8.33 | 8.05% | $90.92 |
| Beauty & personal care | $4.62 | 10.35% | $39.25 |
| Attorneys & legal | $9.87 | 5.55% | $131.63 |
| Dentists | $8.00 | 10.67% | $72.97 |
| Auto repair | $4.35 | 15.51% | $29.96 |
On the Meta side, the most recent leads benchmarks available show a 7.72% conversion rate at a $27.66 cost per lead, with roughly four out of five industries seeing conversion rates decline year over year. Those figures predate 2026, so treat them as direction rather than a target.
The landing page checklist for paid ads: twelve checks
1. Message match. The headline should repeat the promise in the ad, close to word for word. If the ad says “same-week court resurfacing” and the page says “Welcome to our company”, you are paying for a click and then asking the visitor to re-qualify themselves.
2. One page per offer, not per campaign. A separate page for each ad group is usually overkill; a separate page for each distinct offer is not. The test is whether the headline could honestly change per group without rewriting the page.
3. Speed, measured on a phone. Deloitte and Google’s study across EU and US brands found that a 0.1 second improvement in mobile load time lifted retail conversions by 8.4% and travel conversions by 10.1%. A tenth of a second. Mobile is now around half of all web traffic, so this is the median experience, not an edge case — and it is the same work as passing Core Web Vitals on a WordPress site.
4. The offer is above the fold. Nielsen Norman Group’s eyetracking work found 57% of viewing time happens above the fold and 74% within the first two screenfuls. Headline, proof, and the action — all visible without scrolling on a phone.
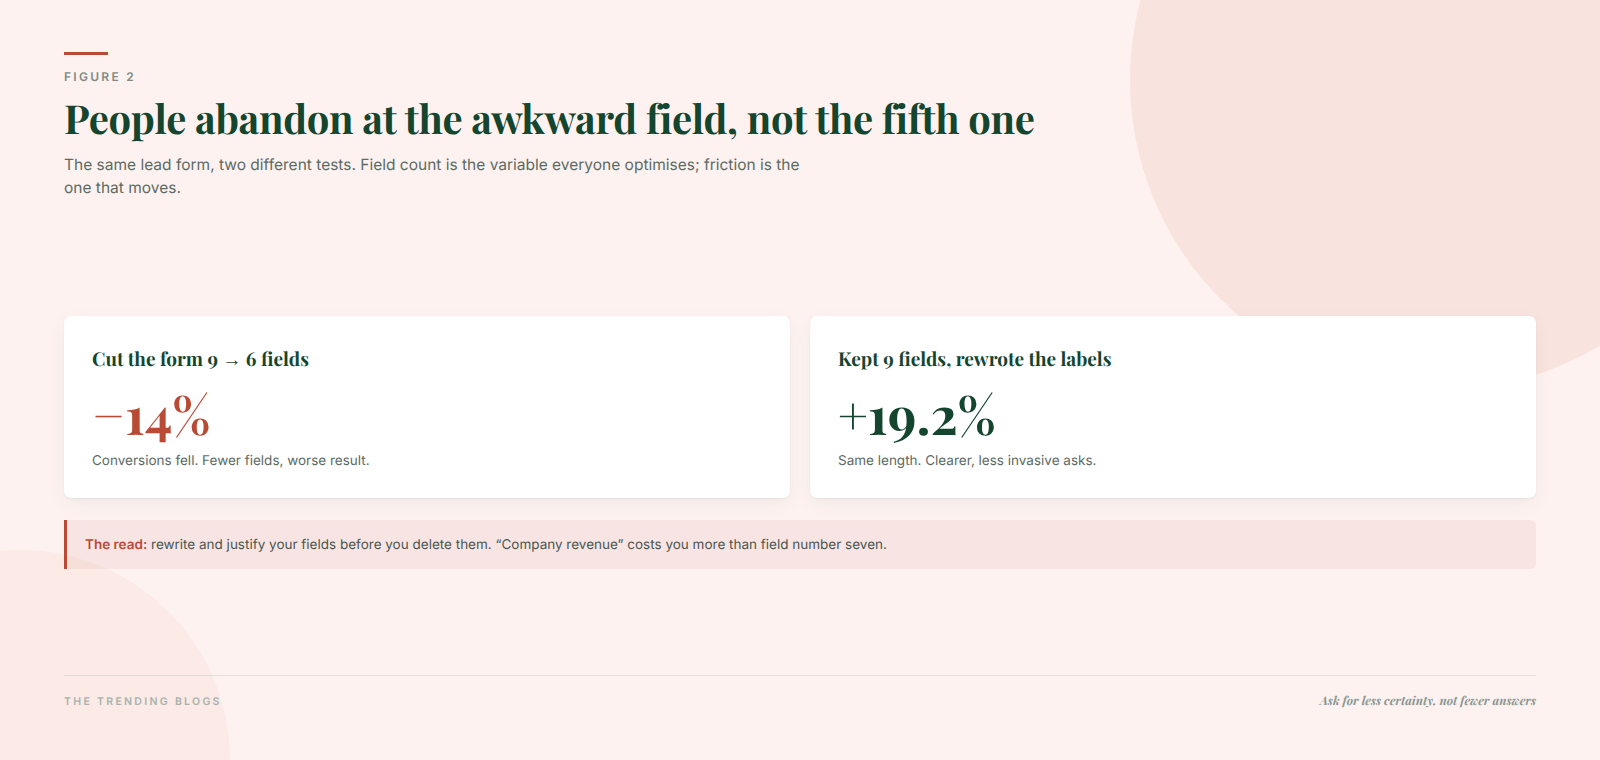
5. Form friction, not form length. This is the check most listicles get backwards. In a well-known Unbounce test, cutting a form from nine fields to six dropped conversions by 14%, while keeping all nine and rewriting the labels raised them by 19.2%. People abandon at the field that feels invasive or ambiguous — a bare “Phone”, or “Company revenue” — not at field number five. Rewrite and justify your fields before you delete them.
6. Real social proof, at the right rating. Northwestern’s Spiegel research found five reviews raise purchase likelihood by 270%, and that likelihood peaks between 4.0 and 4.7 stars before declining toward a perfect 5.0 — a flawless rating reads as fake. For local businesses, BrightLocal’s 2026 survey found 68% of consumers require 4.0 stars or better, 47% will not consider a business with fewer than 20 reviews, and 74% want reviews from the last three months. Recency is a landing page asset.
7. One primary action. A form or a call, with the second option clearly secondary. Two equal buttons is a decision you have handed to the visitor.
8. Tap-to-call that a human answers. For local services this is where money leaks. Invoca’s 2026 home services data found only 52% of callers reach a person, 38% of answered calls are genuine leads, and 45% of those leads close on that call. Your page’s conversion rate is capped by phone staffing, not by the hero image.
9. Speed to lead. The canonical research here is old — MIT and InsideSales found the odds of contacting a lead drop about 100× between five and thirty minutes, and Harvard Business Review’s 2011 audit of 2,241 companies found an average response time of 42 hours with 23% never responding at all. No credible newer replication exists, so date it honestly. The practical rule holds: a five-minute callback beats a better landing page.
10. Trust signals where the doubt is. Licence numbers, insurance, service area, real photos of real staff, and a physical address. Verified-buyer badges alone measured a 15% lift in the Spiegel data. Put them next to the form, not in the footer.
11. It must satisfy Google’s destination rules. Landing page experience is one of the three Quality Score components, and Google’s destination requirements policy disallows hard-to-navigate pages, mismatched display and final URLs, and pages built mainly to send visitors elsewhere. This is not just cosmetic — it prices your clicks.
12. Check which page Google actually served. With final URL expansion in AI Max and Performance Max, the served page can differ from the one you configured. It breaks UTM parsing and page-level reporting silently, with no error anywhere. Report on expanded landing page views, and set URL exclusions for anything not conversion-ready: blog posts, careers pages, thin location pages.
Tracking, so you can tell what happened
None of the above is measurable without a few things being right. Consent mode is mandatory for EEA and UK traffic; without it, denied consent means no signal and no modelling. Enhanced conversions are technically optional but effectively required for match quality — and Google’s own timeline had enhanced conversions for web and for leads merging into one feature in June 2026, with offline imports moving to the Data Manager API. Server-side tagging is a durability choice, not a compliance one.
Then look at the right report. Paid versus organic performance lives or dies on one dimension, which we walk through in the GA4 reports that actually tell a small business something.
Retargeted visitors have already seen the page once, so send them somewhere that answers the objection they left with. The small-budget retargeting playbook shows how to match the offer to the page.
The three mistakes we see most
Sending paid traffic to the homepage. A homepage is built for people who already know you. Paid traffic does not.
Treating the page as the whole funnel. Half the calls never reach a person, and the leads that do mostly close on that first call. Answering the phone is a landing page optimisation.
Redesigning instead of testing one thing. A full redesign changes twenty variables and teaches you nothing. Change the headline, or the form labels, and give it enough traffic to read.
The wider shift behind all of this — automated bidding, machine-picked landing pages, AI answers absorbing organic clicks — is the subject of how AI is changing digital marketing in 2026. And if the page itself needs rebuilding rather than tuning, our guides to cutting load time on a real site and choosing a web development agency cover the build side.
One last framing. At a $90 cost per lead in home services, a landing page that converts at 5% instead of 8% is not a design problem — it is roughly a third of your media budget. Which is exactly the argument for working your marketing budget backwards from cost per customer rather than picking a percentage of revenue.
What one point of conversion rate is worth
The reason to run this checklist before raising budget is arithmetic. Take a home services advertiser spending $3,000 a month at an $8.33 average CPC. That buys roughly 360 clicks.
| Conversion rate | Leads/month | Cost per lead |
|---|---|---|
| 5% | 18 | $167 |
| 8% (category average) | 29 | $103 |
| 11% | 40 | $75 |
Three points of conversion rate — a headline that matches the ad, a form that does not ask for revenue, reviews visible above the fold — is the difference between 18 leads and 29 on identical spend. Buying that extra 11 leads with budget instead would cost roughly $1,150 a month, every month.
Common questions
What is a good landing page conversion rate for Google Ads?
All-industry Google Ads search converts at about 8.18%, and the most recent Unbounce landing page benchmarks put the median at 6.6% across industries. Both are averages across enormous samples — your vertical’s figure is the one to beat, and auto repair at 15.5% and legal at 5.6% are the same “average”.
Do I need a separate landing page for every ad group?
Usually not. Build one page per distinct offer, and use dynamic headline insertion or a short qualifying line for variations within it. The test is whether the headline would honestly need to change — if it would, that is a new page.
Why am I getting clicks but no conversions?
In rough order of likelihood: the page does not match the ad’s promise, the form asks for something the visitor is not ready to give, the phone is not being answered, conversion tracking is broken, or Google is expanding your final URL to a page you never intended to send traffic to. Check tracking and the served URL before you conclude the page is bad.
