Search this question and you will be told to spend 7 to 8% of revenue on marketing, usually attributed to the US Small Business Administration. We could not find that figure on any current SBA page. It is folklore that got repeated until it sounded official — and even if it were official, it would be the wrong tool for most small businesses. Here is what the actual data says, and how to set a number you can defend. So, how much should a small business spend on marketing? Start with your cost per customer, not a percentage.
The benchmarks, and why they don’t describe you
Two surveys anchor this conversation every year.
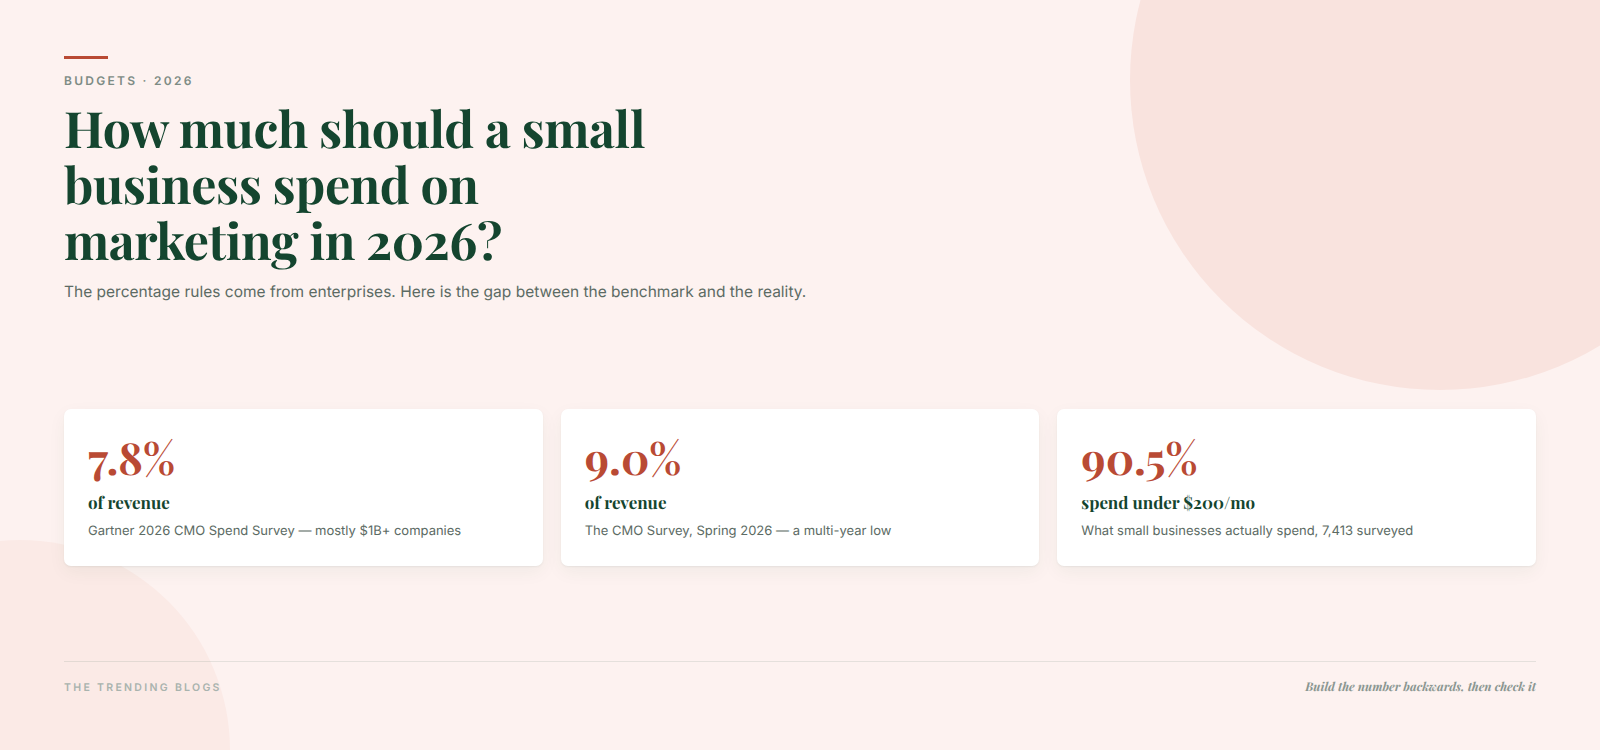
- Gartner’s 2026 CMO Spend Survey puts marketing at 7.8% of company revenue, up marginally from 7.7% in 2025. Sample: 401 CMOs, mostly at companies above $1 billion in revenue.
- The CMO Survey (Deloitte and Duke, Spring 2026) puts it at 9.0% of revenue and 9.6% of total company budget — both multi-year lows. Sample: 308 US marketing leaders, 97% VP or above.
Now the number that reframes all of it. A UENI survey of 7,413 businesses in August 2026 found 26.1% of small businesses plan to spend nothing at all on marketing, 39.4% spend between $1 and $50 a month, and 90.5% spend under $200 a month. Only 3.8% spend $500 or more.
So the honest answer to “what do businesses like mine spend?” is: far less than the percentage rules imply, and mostly not enough to buy a readable test in any competitive vertical. The percentage benchmarks come from enterprises. They are a sanity check on an established business, not a planning tool for a growing one.
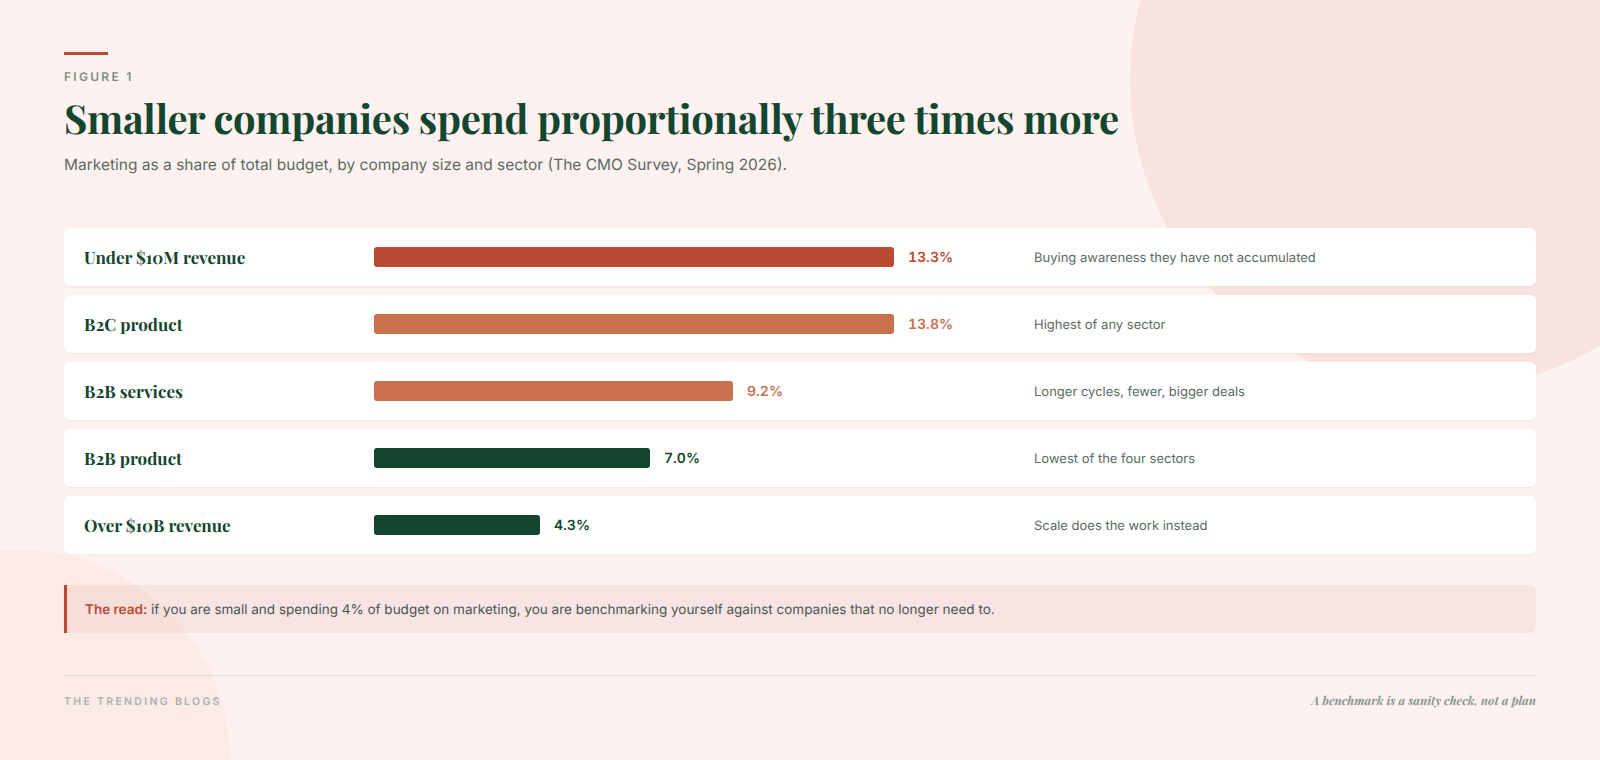
Size and sector both move the number, and in a direction worth noticing. Companies under $10 million in revenue allocate 13.3% of budget to marketing; companies above $10 billion allocate 4.3%. Smaller firms spend proportionally about three times more, because they are buying awareness they have not accumulated yet.
| Sector | % of budget | % of revenue |
|---|---|---|
| B2B product | 7.0% | 7.0% |
| B2B services | 9.2% | 10.1% |
| B2C product | 13.8% | 12.0% |
| B2C services | 11.5% | 7.2% |
Build the number backwards instead
For anyone under roughly $1 million in revenue, percentage-of-revenue is guesswork dressed up as a benchmark. Work from the outcome you need.
- Revenue target ÷ average order value (or customer lifetime value) = customers needed
- Customers ÷ your lead-to-sale rate = leads needed
- Leads × your cost per lead = media budget
- Media budget ÷ (1 − management fee %) = total budget
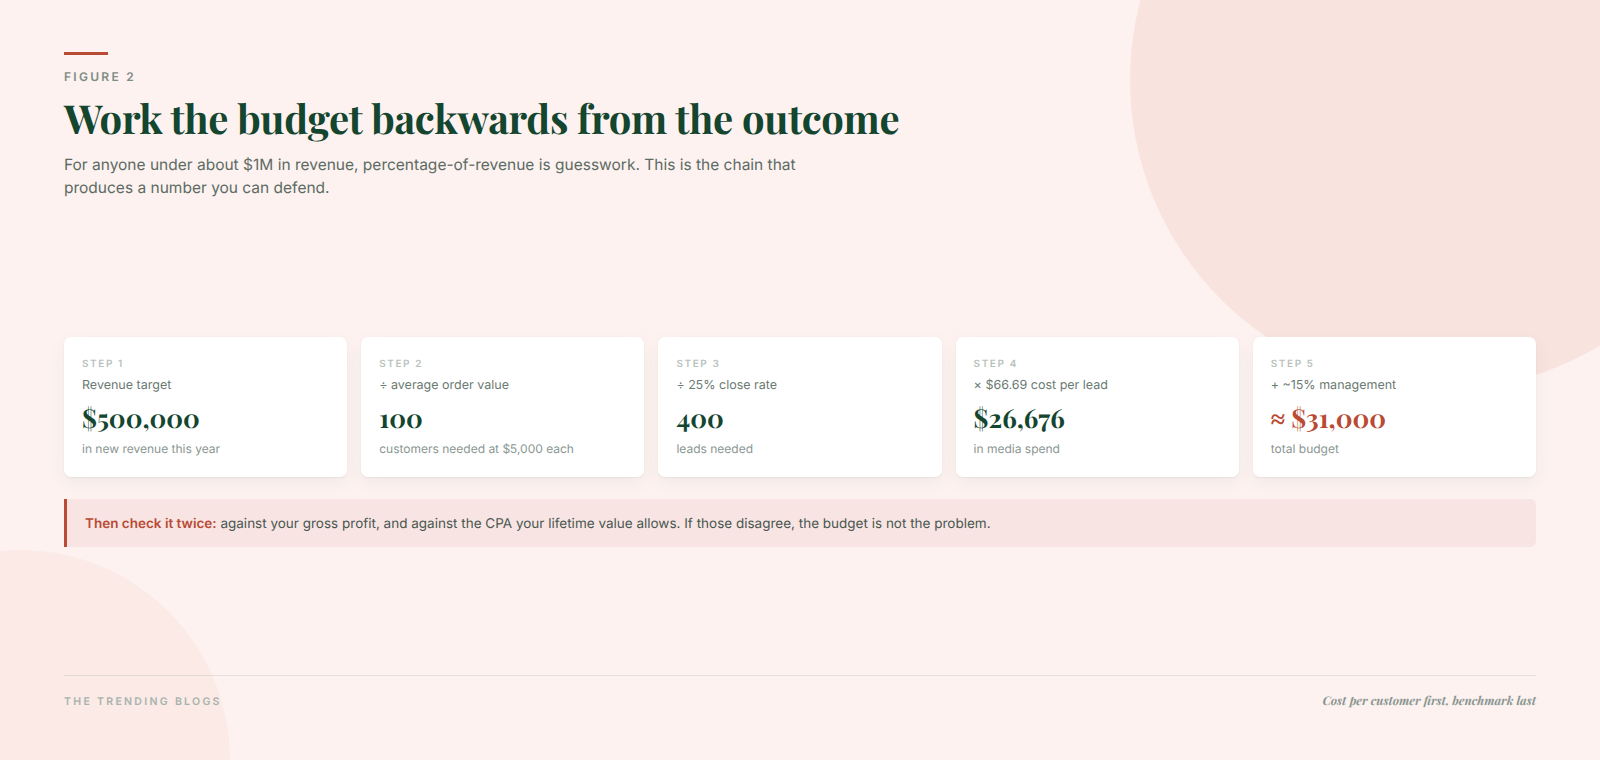
A worked example. You want $500,000 in new revenue at a $5,000 average order value — 100 customers. At a 25% lead-to-sale rate that is 400 leads. At the all-industry $66.69 cost per lead from WordStream’s 2026 Google Ads benchmarks, that is $26,676 in media, plus roughly 15% management, so about $31,000 total for the year.
If you do not know your own close rate yet, published industry rates are a starting placeholder: HVAC and business insurance around 26%, ecommerce 23%, manufacturing 16%, B2B SaaS 13%, construction 12%, legal services 10%. Replace them with your own numbers as soon as you have a quarter of data — these are vendor-published figures, useful as ranges rather than truth.
The affordability check people skip
Percentage-of-revenue rules quietly assume you can absorb the spend out of margin. A business running a 10% net margin that spends 8% of revenue on marketing is betting nearly all of its profit on the campaign working. The honest constraint is share of gross profit, not share of revenue.
Then check the ceiling from the other direction. Your allowable cost per acquisition is roughly gross margin × lifetime value ÷ your target payback multiple. A $1,200 lifetime value at 50% margin against a 3:1 target gives you a $200 maximum CPA. If clicks in your vertical run $8.33 and you convert at 8%, your cost per lead is about $104 — and if only one in four leads closes, your cost per customer is around $416. That is a channel viability problem, and no budget percentage fixes it. You would need a better landing page, a better close rate, or a different channel.
Which is why the page you send traffic to is a budget decision, not a design decision — the twelve checks in our landing page checklist for paid ads are the cheapest way to move that maths in your favour.
What things cost in 2026
- Google Ads search: $5.42 average CPC, 8.18% conversion rate, $66.69 cost per lead across 13,474 US campaigns. Cost per lead fell for the first time in five years.
- Meta Ads: $15.06 average CPM, up 13.2% year over year, with conversion rates down 4.7% and a 1.88× average ROAS across 40,000-plus brands. Sixteen of seventeen industries saw CPMs rise.
- Minimum viable budget: in a vertical with $8.33 clicks and 8% conversion, roughly $1,000 a month buys about 120 clicks and 10 leads. Below $1,000–1,500 a month in high-CPC local verticals you cannot generate data you can read, let alone optimise.
- Agency fees: percentage-of-spend models commonly run 10–20% of media with a minimum. Flat retainers scale roughly with spend: $500–2,000 a month at $1–5k of spend, $1,500–5,000 at $5–25k. Most small business engagements land between $1,500 and $5,000 a month.
The divergence in that first two bullets is the most actionable fact in this post: search costs per lead came down while social CPMs went up. For most lead-generation businesses in 2026 that argues for a search-weighted mix, tested rather than assumed.
If part of that budget goes to retargeting, size it to the audience rather than a percentage. Retargeting on a small budget walks through the maths.
Where the budget is moving
Paid media is taking a bigger share. Gartner has paid media at 31.4% of marketing budgets, a five-year high, with martech down to 19.4% — a five-year low — and AI now a 15.3% line item. Digital is 67.5% of total marketing expense, up from 54.9% in 2023.
Organic clicks are genuinely harder to win. Ahrefs’ analysis of 300,000 keywords, published February 2026, found position-one click-through rate is 58% lower when an AI Overview is present — sharply worse than the 34.5% they measured in April 2025. Content still compounds, but a plan built on 2022-era organic traffic assumptions will miss. The response is not to abandon content; it is to write for citation. That is the subject of getting your business cited by ChatGPT and AI Overviews, and roughly 40% of companies now do some form of it deliberately.
Tooling bills are less predictable than they were. 56% of organisations have shifted martech spend to usage-based pricing, and half of those are continually renegotiating to avoid cost spikes. If you are adding AI tools this year, budget for variability — and be deliberate about it. Our shortlist of AI tools worth paying for and the cost comparison in Zapier vs Make vs n8n both come down to the same discipline: know what unit you are being billed in.
How much should a small business spend on marketing? A number you can defend
If you want one rule of thumb: an established small business with steady demand can sanity-check itself against 8 to 11% of revenue, and a business trying to grow faster than its category should expect to be at the top of that or above it. But derive the figure from cost per customer first, then check it against gross profit, then compare it to the benchmark — in that order. A budget built the other way around is a number you cannot explain when it stops working.
For the strategic context behind these shifts, how AI is changing digital marketing in 2026 covers what changed and which moves are worth making this year.
Common questions
What percentage of revenue should a small business spend on marketing?
As a sanity check, 8 to 11% of revenue for an established business with steady demand, and higher if you are trying to grow faster than your category. But derive the number from cost per customer first — the percentage is how you check the answer, not how you get it.
Is 5% of revenue enough?
It can be, for a business with strong repeat custom, referrals, or an established brand. It is rarely enough for one buying most of its demand in a competitive paid channel. The honest test is not the percentage — it is whether that budget buys enough leads at your cost per lead to hit your revenue target.
How much should I budget for Google Ads per month?
Enough to generate readable data, which in most local verticals means $1,000 to $1,500 a month as a floor. At an $8.33 average CPC that is about 120 to 180 clicks and 10 to 15 leads — thin, but enough to learn from. Below that you are sampling, not testing.
What does an agency charge a small business?
Percentage-of-spend arrangements commonly run 10 to 20% of media with a monthly minimum. Flat retainers scale with spend, from around $500 to $2,000 a month at low spend levels up to $4,000 to $12,000 at $25,000-plus. Most small business engagements land between $1,500 and $5,000 a month. Whichever model, the fee belongs in the budget calculation, not beside it.
